Why Your Factory Is Losing Money to Downtime (And How to Stop It)
Unplanned machine downtime is the biggest hidden cost on most shop floors - and most factories never calculate it. Here's the formula, the five top causes, and the cycle to start eliminating it.

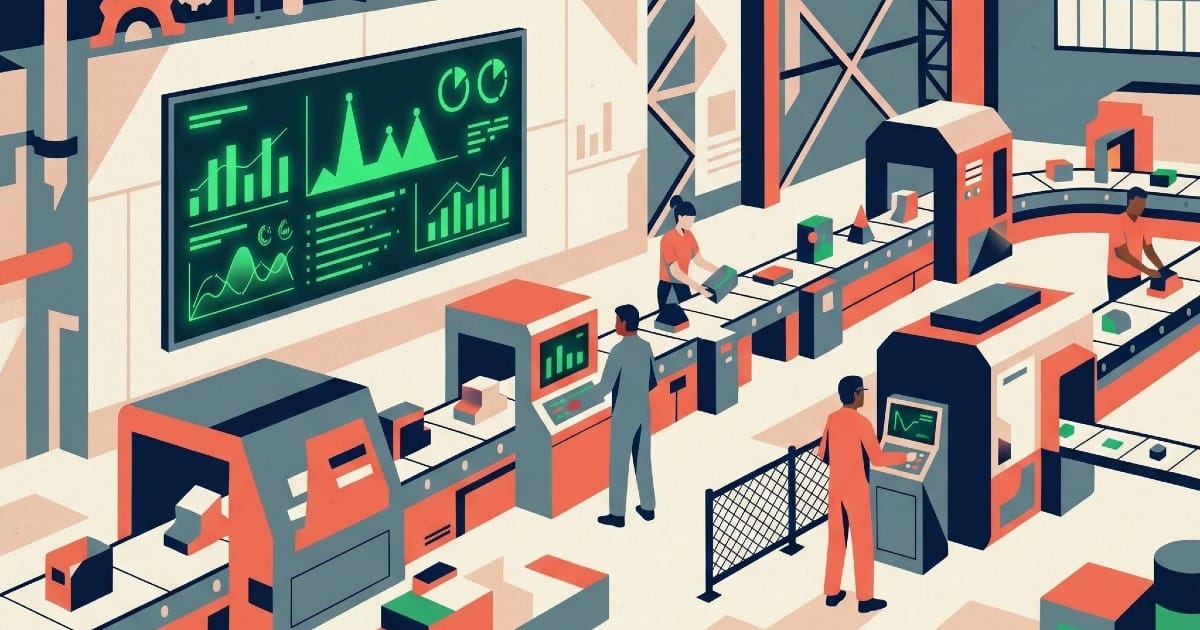
TL;DR: Unplanned machine downtime is the single biggest hidden cost on most shop floors. The average manufacturer loses 5–20% of productive capacity to stoppages they never fully analyze. This post walks through how to calculate your real downtime cost, why most factories underestimate it, and the practical steps to start reducing it - starting today.
The Number Nobody Wants to Calculate
There's a number hiding on your shop floor that most plant managers would rather not see.
It's not in your ERP. It's not in your shift report. It doesn't show up on any dashboard unless you've specifically built one to capture it. But it's there, every shift, quietly draining output, revenue, and margin.
That number is your true downtime cost.
Not "the machine was down for 40 minutes" - everyone knows that happened. The real number is what that 40 minutes cost you in lost production, in labor that was paid but not producing, in overtime needed to catch up, in orders that shipped late, in customer relationships that eroded just a little more.
Most factories never calculate it. And because they don't calculate it, they never fix it.
This post is going to change that.
What Is Unplanned Downtime?
Unplanned downtime is any period when a machine or production line stops unexpectedly - not as part of a scheduled maintenance window, not during a planned changeover, but because something broke, jammed, ran out, or failed.
It's the hydraulic press that seized at 10:47am. The conveyor belt that slipped. The CNC machine that threw an error code and nobody could remember the reset sequence. The raw material bin that ran out because nobody was tracking it.
Every manufacturer has these moments. The question isn't whether you have unplanned downtime - you do. The question is how much it's costing you, and whether you're doing anything systematic about it.
The Downtime Cost Formula
Here's the calculation most manufacturers skip. It's not complicated - it just requires honest numbers.
Step 1: Calculate your hourly production value
Hourly Production Value = (Daily Revenue Target) ÷ (Production Hours per Shift × Number of Shifts)
Example: If your line targets $8,000/day across two 8-hour shifts:
$8,000 ÷ 16 hours = $500/hour
Step 2: Estimate your actual downtime per shift
Be honest here. If you're not tracking it systematically, start with a conservative estimate - operators typically report 30–90 minutes of unplanned stoppages per 8-hour shift on lines without formal tracking.
Downtime per Shift = 45 minutes (0.75 hours) - conservative estimate
Step 3: Calculate daily downtime cost
Daily Downtime Cost = Hourly Production Value × Downtime Hours × Number of Shifts $500 × 0.75 × 2 shifts = $750/day
Step 4: Annualize it
Annual Downtime Cost = Daily Downtime Cost × Working Days $750 × 250 days = $187,500/year
On a single line. With a conservative downtime estimate.
If you have three lines and your actual downtime is closer to 90 minutes per shift, you're looking at over $1M in lost annual output - from a problem that most manufacturers treat as an unavoidable cost of doing business.
It is not unavoidable. It is just unmeasured.
Use our free Manufacturing ROI Estimator to run this calculation with your actual numbers.
Why Most Factories Underestimate Their Downtime
If downtime is this expensive, why don't more manufacturers attack it systematically?
Three reasons:
1. They measure total downtime, not categorized downtime
Knowing that your line was down for 3.5 hours this week is interesting. Knowing that 2.1 hours of that was due to a specific feeder jam on Station 4 - and that the same jam happened four times last month - is actionable.
Total downtime is a lagging indicator. Categorized downtime by cause, by machine, by shift, and by time of day is what drives elimination.
Most paper-based and spreadsheet systems capture total minutes. They don't capture structured cause codes. So the data exists in volume but can't be analyzed in a way that points to specific fixes.
2. They only count the machine, not the ripple
A 20-minute stoppage on a bottleneck machine doesn't cost 20 minutes of production. If it's the constraint in your flow, every downstream station starves. Every upstream station backs up. Operators stand idle. The 20-minute mechanical event becomes a 45-minute production impact.
Most downtime estimates only count the machine clock. The true cost includes the system-wide ripple - which is almost always larger.
3. The data dies at the shift handover
The outgoing supervisor tells the incoming supervisor about the big events. The minor stoppages - the 8-minute jam, the 12-minute material shortage, the 6-minute reset - get filtered out in verbal handovers. By the time the week's data is assembled, the small stoppages have disappeared.
But small stoppages, occurring repeatedly across hundreds of shifts, add up to enormous losses. They're invisible precisely because each individual event seems minor.
The Five Most Common Causes of Unplanned Downtime
Across manufacturing industries, these five categories account for the majority of unplanned stoppages:
1. Equipment failure / mechanical breakdown The most visible category. Bearings fail, belts break, seals leak. These are typically the easiest to address with preventive maintenance - but only if you know which machines are failing, how often, and why.
2. Material / supply issues Lines stop because the right material isn't at the right station at the right time. Bin runouts, wrong material staged, supplier quality rejections. Often attributed to "inventory problems" when the root cause is visibility - nobody knew the bin was almost empty.
3. Changeover and setup Sometimes categorized as planned downtime, but excessive changeover time - especially when it's inconsistent between operators or shifts - is a major source of unplanned loss. A changeover that "should" take 20 minutes but regularly takes 35 is 15 minutes of hidden downtime per run.
4. Operator-related stoppages Training gaps, unclear work instructions, process ambiguity, and shift communication failures. Not a people problem - a systems problem. When the system doesn't make the right action obvious, operators improvise, and improvisation creates variation.
5. Maintenance response lag The machine flags a problem. The operator tells someone. That someone is in a meeting. The message gets passed along. By the time maintenance arrives, 40 minutes have elapsed. The fix itself takes 10 minutes. Response lag is the hidden multiplier on every mechanical issue.
From Tracking to Fixing: The Downtime Reduction Cycle
Tracking downtime is not the goal. Eliminating it is. But elimination requires a systematic cycle:
1. Capture - Log every stoppage at the moment it happens, with a standardized cause code and timestamp. Not at the end of the shift. Not in a morning meeting. At the moment of occurrence.
2. Categorize - Force every stoppage into a structured cause category. Free-text notes are unanalyzable. Standardized reason codes (mechanical failure, material shortage, changeover, operator, planned) create a queryable dataset.
3. Analyze - After 2–4 weeks of clean data, run the Pareto. Which machine has the most stoppages? Which cause code dominates? Which shift has the highest frequency? The answer is almost always surprising - and almost always actionable.
4. Fix - Target the top cause on the top machine. One focused fix. Measure before and after. The ROI of targeted downtime reduction is typically visible within a single week.
5. Repeat - Once the top cause is addressed, the second cause becomes the top cause. The cycle continues. Each iteration improves your OEE and compounds the return.
This is the methodology behind SnapTrack: designed to make Step 1 and Step 2 take 3 seconds per stoppage, on any device, with no hardware installation - so the data you need for Steps 3 through 5 actually exists.
Stop guessing. Start tracking.
Know why your line stopped. In 3 seconds.
SnapTrack lets operators log machine stoppages with a single tap - on any device, no hardware required. You get real-time visibility, standardized reason codes, and the data you need to eliminate your top downtime causes. Free tier available. No credit card needed.
✓ Free tier forever · ✓ Deploy in minutes · ✓ No IT department needed
What Good Downtime Tracking Looks Like in Practice
Here's what the first 30 days of systematic downtime tracking typically reveals in a shop that's been running without it:
Week 1: Data volume shock. Managers discover that the actual number of stoppages per shift is 2–3x what they estimated. The small events that never made it into reports are now visible.
Week 2: Pattern emergence. One machine or one cause code begins to dominate the data. Often it's a machine everyone "knew" was problematic - but nobody had the numbers to justify prioritizing the fix.
Week 3: Cross-shift comparison. The data starts showing shift-level variation. Machine A loses 18 minutes/shift on the morning crew and 47 minutes on the afternoon crew. Same machine, different process discipline. That's a training or handover gap, not a mechanical problem.
Week 4: First Pareto analysis. Top 3 causes account for 70%+ of downtime. Maintenance team gets a prioritized list for the first time. A targeted fix plan is possible.
This is the transition from reactive to data-driven maintenance - and it starts with a logging system that operators will actually use.
The Operator Adoption Problem
Every downtime tracking system fails if operators don't use it consistently.
The barrier is almost never resistance to the concept. Operators understand why tracking matters. The barrier is friction - systems that require too many taps, force operators to leave their station, demand login credentials, or don't work on the device at hand.
The rule of thumb: if logging a stoppage takes more than 60 seconds, data quality will degrade within two weeks. Operators will batch-log at the end of the shift (losing timestamps and cause accuracy), skip minor stoppages entirely, or stop logging altogether.
Effective downtime tracking requires:
- One-tap logging from any device on the floor
- Pre-defined cause codes (no free text required)
- No login friction at the point of capture
- Immediate confirmation so operators know the log went through
This is the design constraint SnapTrack was built around. The capture experience is optimized for the operator standing at a machine, not for the analyst reviewing reports. Both matter - but adoption happens at the machine, not the dashboard.
→ See how SnapTrack handles operator-level downtime capture
Calculating Your OEE Baseline
Downtime directly impacts OEE (Overall Equipment Effectiveness) through the Availability component. Before you start a downtime reduction program, establish your baseline.
OEE = Availability × Performance × Quality
Availability = (Planned Production Time − Downtime) ÷ Planned Production Time
If your line runs a planned 8-hour shift and loses 45 minutes to unplanned stoppages:
Availability = (480 − 45) ÷ 480 = 90.6%
World-class OEE is typically cited at 85%+. But Availability alone at 90.6% means your Performance and Quality losses are compounding on top of an already-reduced base.
Use our free OEE Quick-Check Calculator to establish your baseline across all three components before you start tracking improvements.
Frequently Asked Questions
What is the average cost of machine downtime in manufacturing? Industry benchmarks vary by sector and line value, but a commonly cited figure is $260,000 per hour for automotive manufacturing. For smaller operations, the number is obviously lower - but the methodology is the same: hourly production value multiplied by downtime hours, accounting for labor, lost output, and ripple effects. Use the formula in this post to calculate your specific number.
What causes the most downtime in manufacturing? Equipment failure and mechanical breakdown are the most visible causes, but material/supply issues, excessive changeover time, and maintenance response lag collectively account for a significant share of total unplanned downtime - often more than pure mechanical failures. The only way to know your top cause is to track with structured reason codes.
How do you reduce unplanned downtime? The proven approach is the capture-categorize-analyze-fix cycle: log every stoppage with a structured cause code, run a Pareto analysis after 2–4 weeks, target the top cause on the top machine, measure the improvement, and repeat. The prerequisite is a logging system operators will actually use consistently.
What is the difference between planned and unplanned downtime? Planned downtime is scheduled: preventive maintenance windows, changeovers, shift breaks, and calibration. Unplanned downtime is unexpected: mechanical failures, material shortages, operator issues, and process failures. OEE's Availability metric measures only unplanned downtime against planned production time.
How does downtime tracking improve OEE? Downtime tracking improves OEE by making Availability losses visible and attributable. Without tracking, you know your OEE is low but can't identify why. With structured downtime data, you can pinpoint the specific machines and causes driving Availability losses - and fix them in priority order.
How long does it take to see results from downtime tracking? Most operations see actionable patterns within 2–4 weeks of consistent tracking. The first Pareto analysis typically reveals that 2–3 causes account for 70%+ of downtime - giving maintenance a clear, prioritized fix list. Measurable OEE improvements typically appear within 4–8 weeks of targeting the top cause.
The Bottom Line
Unplanned downtime is not an unavoidable cost of manufacturing. It is a measurement problem disguised as an operational problem.
Once you measure it - correctly, consistently, with structured cause codes - the top causes become obvious. And obvious problems, in manufacturing, get fixed.
The factories that will outperform their competitors over the next five years are not the ones that buy the most automation. They're the ones that eliminate the losses hiding in plain sight on their existing lines.
Your downtime cost is real. Now you know how to calculate it, track it, and start eliminating it.
Start tracking downtime with SnapTrack - free tier, no hardware, running in minutes.
Stop guessing. Start tracking.
Know why your line stopped. In 3 seconds.
SnapTrack lets operators log machine stoppages with a single tap - on any device, no hardware required. You get real-time visibility, standardized reason codes, and the data you need to eliminate your top downtime causes. Free tier available. No credit card needed.
✓ Free tier forever · ✓ Deploy in minutes · ✓ No IT department needed
Guy Mizrahi is the co-founder of MikroMES and has 20+ years of experience in MES and manufacturing operations.
Away designs can explore colours beyond a club's usual home palette. Those comparing home and away styles can review retro FC Barcelona jersey(camiseta retro del FC Barcelona) within the appropriate collection. Choosing the correct size is especially important for children's and fitted versions.