OEE Formula Explained: How to Calculate It (With a Worked Example)
OEE = Availability × Performance × Quality. This guide walks through the formula, calculates a worked example you can verify in our free calculator, and shows you which factor your biggest production loss is hiding in.

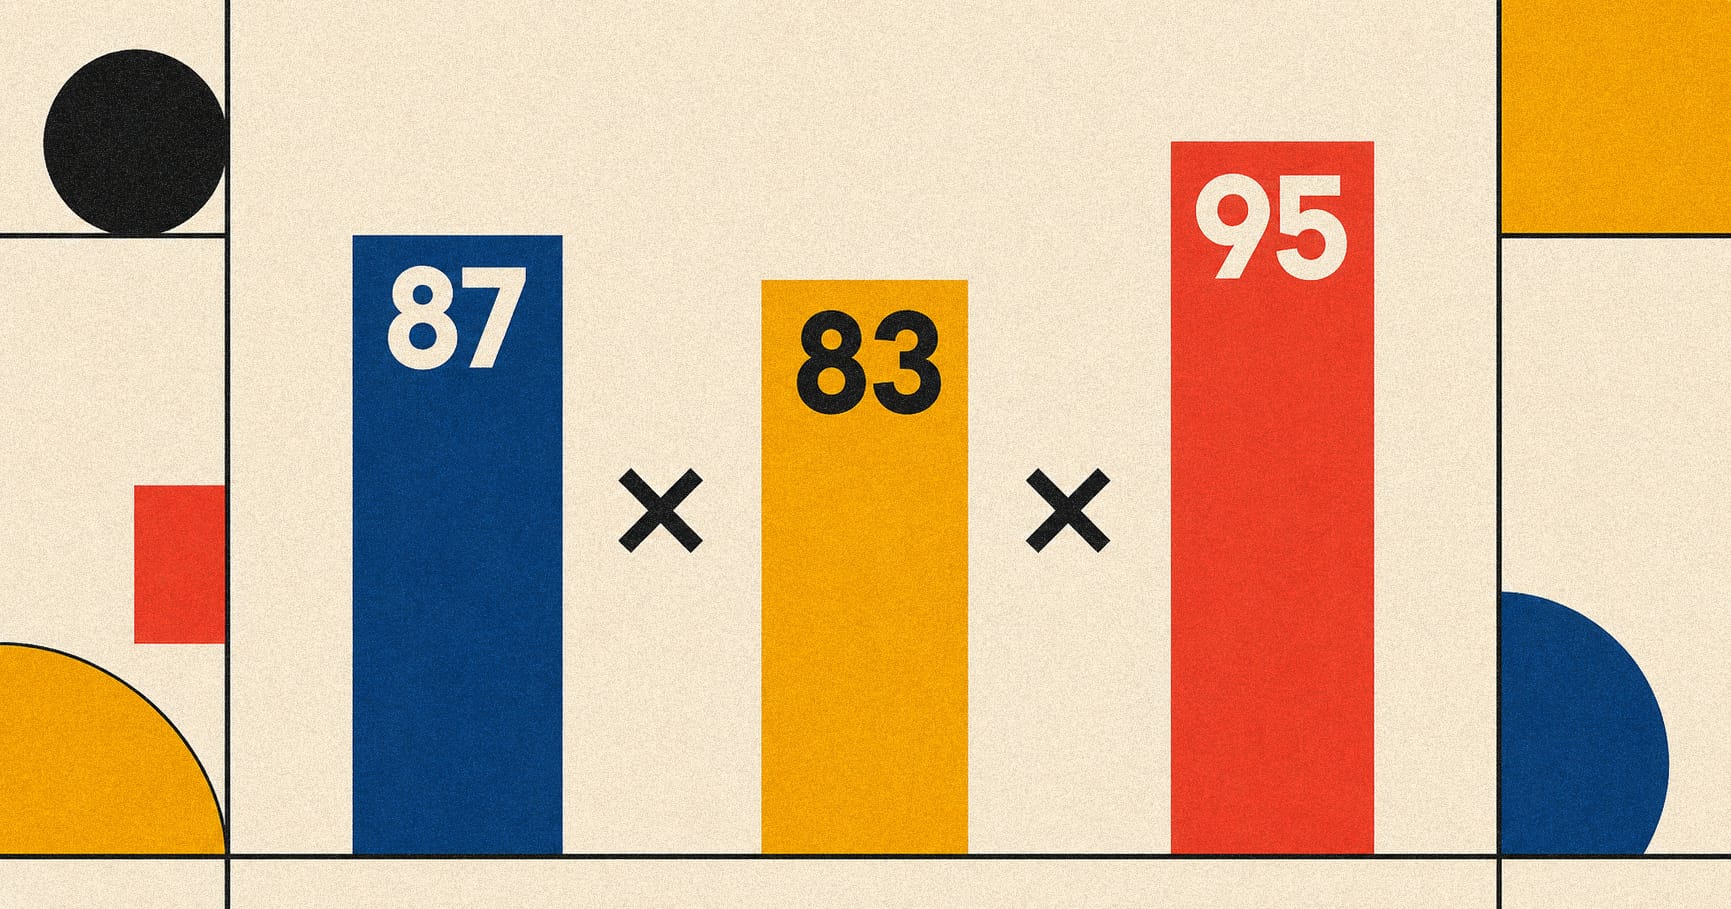
TL;DR: OEE (Overall Equipment Effectiveness) is the product of three factors - Availability × Performance × Quality. Each one is a percentage. Multiply them and you get a single number that tells you how much of your theoretical production capacity you're actually using. This post walks through the formula, shows you how to calculate it from real numbers, and gives you a worked example you can verify yourself in our free OEE calculator.
What the OEE Formula Actually Measures
OEE is the standard manufacturing metric for productivity. It exists because production loss is rarely caused by one thing - it's a combination of stops, slowdowns, and rejects. OEE captures all three in a single number.
The formula is:
OEE = Availability × Performance × Quality
Three multiplied percentages. That's it. The math is intentionally simple - the value is in what each factor isolates.
- Availability answers: was the machine running when it was supposed to be?
- Performance answers: when it was running, did it run at full speed?
- Quality answers: of what it produced, how much was actually sellable?
A machine can score 100% on any individual factor and still have terrible OEE. A line that runs full speed (Performance 100%), produces zero defects (Quality 100%), but only runs half the planned time (Availability 50%) has an OEE of 50% - and the diagnosis is obvious: it's a downtime problem, not a quality or speed problem.
That's what OEE is for. It decomposes "we're not producing enough" into a specific, actionable cause.
The Three Factors, Explained
1. Availability
Formula: Availability = Actual Run Time ÷ Planned Production Time
This is the simplest factor and usually the most painful. It measures unplanned downtime as a percentage of when you intended to be running.
If you scheduled an 8-hour shift (480 minutes) and the machine actually ran for 420 minutes - meaning you lost 60 minutes to unplanned stoppages - your Availability is:
420 ÷ 480 = 87.5%
Note that "Planned Production Time" excludes scheduled breaks and planned maintenance. Those don't count against Availability. Only unplanned losses do.
2. Performance
Formula: Performance = Actual Output ÷ Ideal Output
Ideal Output is what the machine would have produced at its rated speed during the time it was actually running. If your machine is rated at 60 units per minute, and it ran for 420 minutes, its ideal output is 25,200 units.
If you actually produced 21,000 units in those 420 minutes, your Performance is:
21,000 ÷ 25,200 = 83.3%
Performance losses are the most often overlooked. The line is running. Nobody is logging a stoppage. But it's running slower than it should be - micro-stops too short to register, reduced cycle speed to compensate for a quality issue, an operator easing off because they're tired. These small slowdowns add up to a major productivity drain that no downtime log will ever capture.
3. Quality
Formula: Quality = Good Output ÷ Total Output
The simplest of the three. Of all the units the machine produced, how many were sellable?
If you produced 21,000 units and 19,950 of them passed quality:
19,950 ÷ 21,000 = 95.0%
Quality losses include scrap, rework, and units that need any kind of intervention before they're sellable. The cost isn't just the lost units - it's the raw material consumed, the machine time used, and the downstream rework labor required.
Putting It Together: A Fully Worked Example
Let's use the numbers from the three sections above and calculate OEE.
| Factor | Calculation | Result |
|---|---|---|
| Availability | 420 min ÷ 480 min | 87.5% |
| Performance | 21,000 ÷ 25,200 | 83.3% |
| Quality | 19,950 ÷ 21,000 | 95.0% |
OEE = 0.875 × 0.833 × 0.950 = 0.6928 = 69.3%
This line is producing at about 69% of its theoretical maximum capacity.
That sounds bad. It's actually not - 69% sits in the upper half of the global manufacturing distribution. Most facilities run between 40% and 60%. World-class operations target 85%+.
But the more useful insight isn't the headline number. It's the breakdown: this line's biggest loss is Performance, not Availability or Quality. That tells you exactly where to focus - micro-stops, cycle speed, operator pacing. Not maintenance, not QC.
Plug these exact numbers into our free OEE Quick-Check Calculator and you'll see the same 69.3% result.
What's a "Good" OEE Score?
There's an industry convention worth knowing:
| OEE Range | Classification | Reality |
|---|---|---|
| 85%+ | World-class | Achievable, rare in practice |
| 60–85% | Typical | Most well-managed operations |
| 40–60% | Average | Untracked operations land here |
| Below 40% | Underperforming | Likely measurement issues, not just operational |
A common trap: chasing 85% for its own sake. Improvement matters more than the absolute number. Going from 52% to 64% in a quarter is more valuable than holding steady at 78% - because the relative gain in throughput is enormous. Every 5-point OEE improvement on a constrained line represents a 5–8% increase in real production output, depending on where the gain came from.
If you've never measured OEE, your starting score doesn't matter. Establish the baseline, identify the biggest loss factor, and improve it. Repeat.
How to Actually Capture the Data
The formula is easy. Capturing the inputs reliably is where most manufacturers fail.
Availability requires accurate downtime tracking. You need every stoppage logged at the moment it happens, with a reason code. Without that, your "Actual Run Time" is just an estimate. (See our step-by-step guide to tracking downtime without spreadsheets.)
Performance requires a known ideal cycle time per product. Document what the machine should produce per minute when running at rated speed, by product. Without this benchmark, Performance is unmeasurable. Production logs alone don't give you Performance - you need a reference point.
Quality requires inline or end-of-line inspection data. Total Output and Good Output need to be captured at the station, not reconstructed from shipping records or end-of-month inventory counts.
The three inputs come from three different sources, and combining them manually is where most attempts at OEE tracking quietly die. Operators don't log downtime consistently. Cycle times aren't documented. Quality data lives in a different system. By the time someone tries to assemble OEE, the data is incomplete and the calculation is suspect.
This is why automated OEE tracking exists. With SnapTrack capturing your Availability data and FabAI synthesizing it against your production targets and quality logs, OEE becomes a real-time number, not a monthly reconstruction project.
Stop guessing. Start tracking.
Know why your line stopped. In 3 seconds.
SnapTrack lets operators log machine stoppages with a single tap - on any device, no hardware required. You get real-time visibility, standardized reason codes, and the data you need to eliminate your top downtime causes. Free tier available. No credit card needed.
✓ Free tier forever · ✓ Deploy in minutes · ✓ No IT department needed
Common Mistakes in OEE Calculation
Mistake 1: Including planned downtime in Availability. Planned maintenance, scheduled breaks, and unstaffed time don't count against Availability. Only unplanned losses during planned production time. Including planned downtime makes your Availability score worse than it is and tells you nothing useful.
Mistake 2: Using shift output instead of actual output. Performance compares what you produced to what you could have produced during the time you were running. If you ran for 7 hours out of an 8-hour shift, Ideal Output is calculated for 7 hours, not 8. Otherwise you double-count downtime - it already showed up in Availability.
Mistake 3: Counting rework as good output. Rework is not Quality output. A unit that needs to be re-processed costs you twice - once when it was made wrong, once when it's fixed. If you count rework as good, your Quality score becomes meaningless. Good Output should be units that passed inspection the first time.
Mistake 4: Calculating OEE without knowing your ideal cycle time. If you don't have a documented standard cycle time for each product, you can't calculate Performance. Some operations use "best ever observed" as a proxy - that's better than nothing, but it underestimates Performance loss because the best-ever observation already included some loss.
Mistake 5: Averaging OEE across products. A single OEE number across a multi-product line obscures more than it reveals. Product A might run at 85% OEE while Product B runs at 45% - the average tells you nothing about either. Calculate OEE per product, per shift, per machine where possible.
Putting OEE to Work
OEE is diagnostic, not prescriptive. The number alone doesn't tell you what to do - but the decomposition does.
If your biggest loss is Availability: Your problem is unplanned downtime. Track stoppages with reason codes for 2–4 weeks, run a Pareto analysis, and target the top cause. This is usually the fastest path to OEE improvement because reductions are visible immediately.
If your biggest loss is Performance: Your problem is micro-stops or pacing. Look for small unlogged stoppages, slower-than-rated cycle times, and operator behavior. This is harder to track manually - it benefits most from automated capture or real-time pacing displays.
If your biggest loss is Quality: Your problem is process, materials, or training. Look at defect categories, scrap rates by shift, and rework patterns. Often the fix is upstream (incoming material, setup, calibration) rather than at the point of defect.
The discipline is to do this analysis weekly, target one fix per week, and measure whether it moved the right factor. Most operations see OEE improve 8–15 points within 90 days of starting this cycle - not because of a new system, but because they finally know where to look.
Frequently Asked Questions
What is the OEE formula? OEE = Availability × Performance × Quality. Each factor is calculated as a percentage and multiplied together. Availability = Actual Run Time ÷ Planned Production Time. Performance = Actual Output ÷ Ideal Output. Quality = Good Output ÷ Total Output. The final OEE score is a percentage that represents the portion of theoretical maximum capacity you're actually using.
How do I calculate OEE manually? Three steps. First, calculate Availability by dividing actual run time by planned production time. Second, calculate Performance by dividing actual output by ideal output at rated cycle speed. Third, calculate Quality by dividing good output by total output. Multiply all three percentages together. Use our free OEE calculator to verify your math with real numbers.
What is a good OEE score? 85% is considered world-class but is rare in practice. Most well-managed operations sit between 60% and 85%. Untracked operations typically land between 40% and 60%. The absolute number matters less than the improvement trajectory - a sustained 5-point gain in OEE represents significant throughput improvement on any constrained line.
Why is my OEE so low? Low OEE almost always traces to one dominant factor. If Availability is the issue, you have an unplanned downtime problem. If Performance is the issue, you have micro-stops or pacing problems. If Quality is the issue, you have a process or materials problem. Calculate each factor separately to identify which is dragging your overall score.
What's the difference between OEE and uptime? Uptime is a single metric - it measures Availability only. OEE combines Availability with Performance and Quality to give a more complete picture. A line can have 95% uptime but only 60% OEE if it's running slowly or producing defects. Uptime tells you the machine is on. OEE tells you the machine is productive.
Can I calculate OEE in real time? Yes, but only with automated data capture. Manual calculation produces lagging metrics - by the time you have the numbers, the shift is over. Real-time OEE requires three things: live downtime tracking (for Availability), documented cycle times tied to live production counts (for Performance), and inline quality data (for Quality). MikroMES with FabAI handles the synthesis automatically once those inputs are flowing.
The Bottom Line
OEE is one formula with three inputs: Availability × Performance × Quality. The math takes thirty seconds. The hard part is capturing the inputs reliably, shift after shift, so the number you produce reflects reality.
When you have that reliable data, OEE becomes the single most useful diagnostic metric in manufacturing. It tells you, without ambiguity, where your biggest production loss is - and therefore where the next 5 OEE points are hiding.
Calculate yours now in our free OEE Quick-Check Calculator. Then come back when you're ready to automate the capture with SnapTrack and FabAI.
Stop guessing. Start tracking.
Know why your line stopped. In 3 seconds.
SnapTrack lets operators log machine stoppages with a single tap - on any device, no hardware required. You get real-time visibility, standardized reason codes, and the data you need to eliminate your top downtime causes. Free tier available. No credit card needed.
Club colours help connect shirt design with supporter identity. For fans comparing modern and retro styles, Real Madrid jersey(camiseta del Real Madrid) keeps the focus on the selected identity. Personalisation choices should complement the existing colour and layout of the design.
✓ Free tier forever · ✓ Deploy in minutes · ✓ No IT department needed
Guy Mizrahi is the co-founder of MikroMES and has 20+ years of experience in MES and manufacturing operations.