You're Tracking Your Shop Floor. Now What?
Getting data off your shop floor is the hard part, and you've done it. But tracking was never the goal - deciding is. Here's how to turn what you're measuring into decisions that actually change the floor.

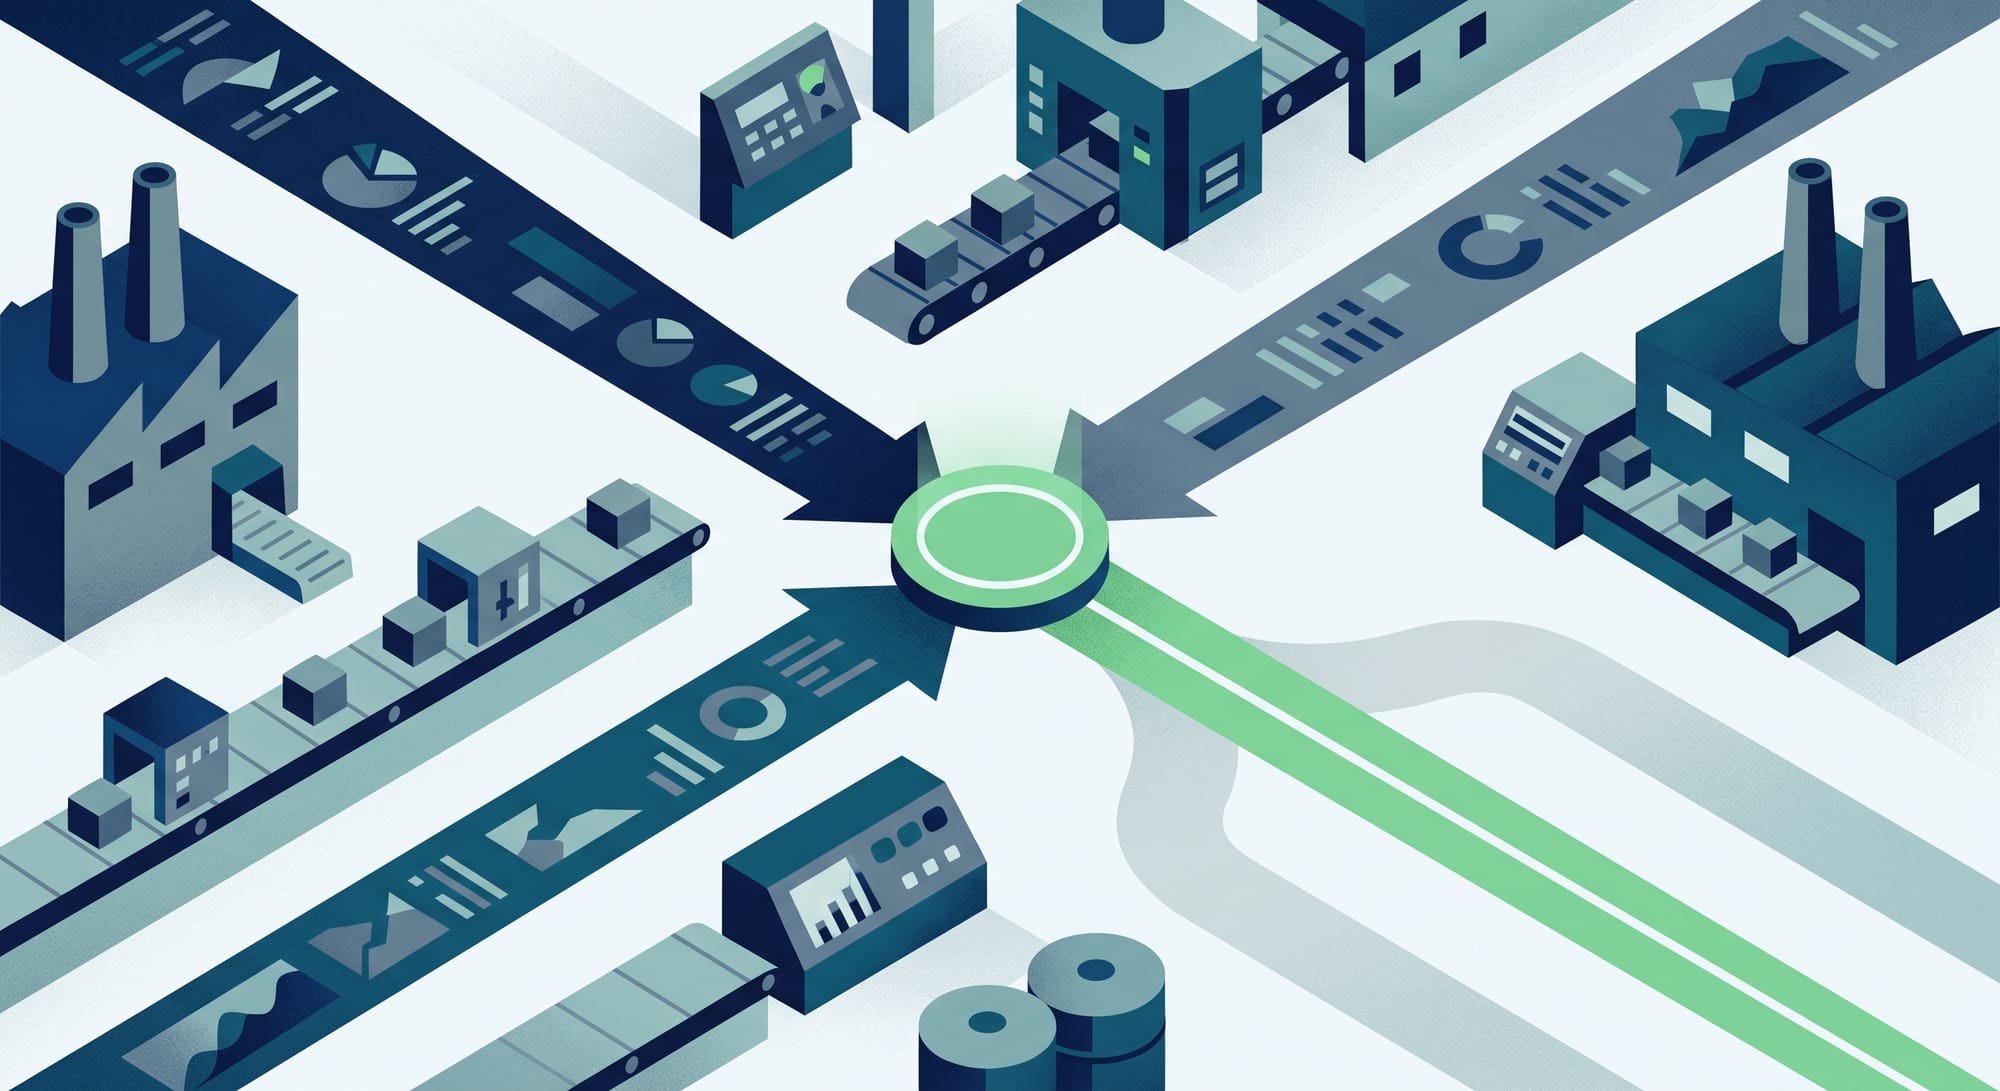
TL;DR: Getting data off your shop floor is the hard part, and if you've done it, you've already cleared the barrier most small manufacturers never get past. But tracking isn't the goal - deciding is. This post covers what to actually do once the data is flowing: how to find the one number that matters this week, how to turn a measurement into a decision, why most shops stall at the dashboard stage, and what the gap is between having data and acting on it. It's the bridge between measuring your floor and running it better.
Congratulations - You've Done the Hard Part
If you're tracking downtime with reason codes, watching your line's pace against target, keeping inventory counts honest, and knowing how material moves from your dock to your line, you've accomplished something most small manufacturers never do.
That's not flattery. The majority of small shops still run on instinct, memory, and end-of-month accounting. Getting real operational data off a working floor - without stopping production, without a six-figure system, without an IT department - is genuinely difficult. The friction is enormous: operators who won't use a clunky system, managers who don't have time to compile reports, and the constant pull of firefighting over measuring.
So if the data is flowing, take the win.
But here's the uncomfortable question that follows: what has actually changed because of it?
For a lot of shops, the honest answer is "not much yet." The data is being captured. Reports exist. Numbers get reviewed in a meeting. And the floor runs about the same as it did before. That's the gap this post is about - the space between tracking and deciding, which is where the real return on all that measurement lives.
The Trap: Measurement Theater
There's a failure mode that catches good operations, and it's worth naming plainly because it's easy to fall into without noticing.
Measurement theater is when data collection becomes the activity rather than the input to an activity. The signs are recognizable:
- Reports get generated and filed, but no decision traces back to them
- The dashboard is up on a screen, but nobody changes what they do because of it
- Numbers are reviewed monthly, discussed, and then everyone returns to the same routine
- More metrics get added over time, without any of the existing ones driving a change
It's easy to slip into because measuring feels like progress. You're being rigorous. You're being data-driven. There's a dashboard. But if you can't point to a specific thing you did differently because of a number, the tracking isn't paying for itself yet.
The test is simple and slightly brutal: name one decision you made in the last month because of what your data showed you. If you can, you're past the trap. If you can't, the rest of this post is for you.
From Data to Decision: The Three Questions
Turning data into action doesn't require sophistication. It requires a repeatable loop, and the loop is three questions asked in order.
1. What's my biggest loss right now?
Not "how are we doing" - that's too vague to act on. The useful question is singular and comparative: of everything my data is showing me, what's costing me the most?
This usually means comparing across categories that don't share units. Your downtime data says you lost eleven hours to stoppages. Your quality data says you scrapped forty parts. Your inventory data says you had three shortages. Which of those is worse?
Convert to a common unit wherever you can - lost production hours, or money, or units of output. The point isn't precision; it's ranking. You're looking for the one item at the top of the list, because that's the only one that matters this week.
If you've been tracking OEE, this is exactly the exercise of breaking the score into Availability, Performance, and Quality and finding which component is weakest. Same logic, applied across your whole operation rather than one machine.
2. What's causing it?
Once you know the biggest loss, you need its cause - and this is where reason codes and detail earn their keep. "We lost eleven hours to downtime" isn't actionable. "We lost six of those eleven hours to changeovers on line 2" is.
Almost every loss you'll find follows a Pareto pattern: a small number of causes account for most of the damage. One machine. One shift. One product changeover. One material that keeps arriving late. Your data should let you drill from the total down to the specific, and if it can't, that's a gap worth closing in how you capture it.
The goal is a cause specific enough that a person could be assigned to fix it.
3. What's the smallest thing I can change?
The instinct when you find a big loss is to propose a big fix - a new machine, a new process, a project. Resist it. The smallest intervention that plausibly addresses the top cause is almost always the right first move, because it's fast, cheap, and reversible, and it tells you whether you understood the problem correctly.
If changeovers are eating your Availability, the small change isn't buying faster equipment - it's staging tooling before the machine stops. If one material keeps causing shortages, it's adjusting that one reorder point, not overhauling your inventory policy.
Make the small change. Then measure again. If the number moved, you understood the problem. If it didn't, you learned something cheaply and you go back to question two.
What This Looks Like in Practice
Here's the loop running on a real-shaped example.
A shop has been tracking for two months. The owner sits down on a Monday with the week's data.
Question 1: Downtime totalled fourteen hours. Scrap was about thirty parts. There was one material shortage that idled a cell for an afternoon. Converting roughly to lost production time, downtime is clearly the biggest bucket.
Question 2: Drilling into the downtime reason codes, five of the fourteen hours are a single code - "waiting for material" - and almost all of it on one cell. That's not a machine problem at all; it's a flow problem, which points back at how material gets from storage to that cell.
Question 3: The smallest change: stage that cell's material for the full shift before it starts, rather than fetching mid-run. No purchase, no process redesign, one habit change for one cell.
Next Monday, the owner looks again. "Waiting for material" on that cell is down to under an hour. The fix worked, and now downtime's top cause is something else - which is exactly what should happen. You've eliminated the biggest loss, so a new one is now the biggest. Run the loop again.
That's continuous improvement with the mystique stripped out. Find the biggest loss, find its cause, make the smallest fix, measure, repeat.
Deploy in minutes, not months
Solve your biggest shop floor problem this week.
MikroMES gives you modular, AI-powered apps for downtime, inventory, production pacing, and maintenance — with FabAI, your built-in agent, surfacing the insights you'd otherwise miss. Pick only what you need. Free tier forever, no hardware, no IT project.
✓ Free tier forever · ✓ Deploy in minutes · ✓ No IT department needed
Why Most Shops Stall Here
If the loop is that simple, why do so many operations get stuck at the dashboard stage? Three reasons, and they're worth being honest about.
The data doesn't answer the question you're actually asking. You want to know "what's my biggest loss," but what you have is four separate views - a downtime report, an inventory list, a quality log, a pacing screen. Answering the question means mentally combining them, and that friction is enough to stop most people. The information exists; the answer doesn't.
Extracting the answer takes longer than you have. Building the comparison means exporting, filtering, and reconciling. On a small shop floor, the person who would do that analysis is the same person handling a supplier call and a customer complaint. The report that would take ninety minutes never gets built - not because it isn't valuable, but because ninety minutes doesn't exist.
The review is too slow to act on. Monthly is an autopsy. By the time you see that changeovers hurt you in September, September is gone. Losses are only recoverable while they're happening or shortly after, so a slow loop turns actionable data into historical trivia.
Notice that none of these are problems with your data. They're problems with the distance between your data and your decision. And that distance - not the measurement itself - is the real bottleneck for a small manufacturer who's already doing the tracking.
Closing the Gap
So how do you shorten the distance between data and decision?
Ask the question directly instead of building the report. This is the biggest shift available to a small shop right now. Rather than assembling views and comparing them yourself, you ask - in plain language - "what was my biggest loss this week?" or "which cell had the most waiting time?" - and get the answer immediately. That's what FabAI does across the MikroMES modules: it sits over your downtime, pace, inventory, and maintenance data and turns the question into an answer, without you building anything.
This is worth being precise about, because it's easy to overstate. It doesn't make the decision for you. It doesn't know your customers, your people, or your constraints. What it removes is the ninety minutes of extraction that was stopping you from asking in the first place. The judgment stays yours; the assembly work goes away.
Shorten the review cycle. Weekly beats monthly, and daily beats weekly for anything fast-moving. The loop above works because it's short enough that the fix and the measurement stay connected.
Look across your data, not just within it. The most valuable findings usually sit at the seams: stoppages that correlate with material arrivals, quality drops on a particular shift, pacing shortfalls that trace to a maintenance delay. Any single module tells you what happened in its domain; the connections tell you why.
Where This Arc Goes Next
This post is the opening of a longer thread. Over the next several posts we're going to work through what actually happens after you're tracking - including where AI genuinely helps, and where it plainly doesn't.
That second half matters as much as the first. There's a great deal of noise right now about AI in manufacturing, most of it written for plants with budgets and infrastructure that small shops don't have. Some of what's promised is real and available today. Some of it needs sensor networks and data volumes you won't have for years. And some problems - supplier reliability, shift handover, whether your team actually uses the system - aren't algorithm problems at all, and no amount of intelligence will fix them.
Sorting those apart honestly is the point of what follows. But it starts here, with the loop: find your biggest loss, find its cause, make the smallest fix, measure again.
You've already done the hard part. Now make it count.
Frequently Asked Questions
I'm tracking shop floor data but nothing has changed. What am I doing wrong? You're likely stuck in measurement theater - where collecting data becomes the activity rather than the input to a decision. The test is whether you can name one specific thing you did differently in the last month because of what a number showed you. If not, the fix is a repeatable loop: identify your single biggest loss, drill into its specific cause, make the smallest change that addresses it, then measure again.
How do I know which shop floor problem to fix first? Compare your losses in a common unit - lost production hours, money, or units of output - and rank them. The goal isn't precision, it's identifying the one item at the top. Then drill into that loss for its specific cause, since almost every loss follows a Pareto pattern where a few causes drive most of the damage. Fix the top cause, re-measure, and the next biggest loss becomes your new target.
Why do most small manufacturers stall after they start tracking data? Three reasons, none of them about data quality. First, the data sits in separate views (downtime, inventory, quality, pace) so answering "what's my biggest loss" requires mentally combining them. Second, extracting that answer takes longer than a busy shop-floor manager has. Third, monthly reviews are too slow - losses are only recoverable while they're happening. The bottleneck is the distance between data and decision, not the measurement.
What is the smallest useful change to make after finding a problem? The smallest intervention that plausibly addresses the top cause - because it's fast, cheap, reversible, and it tests whether you understood the problem correctly. If changeovers are costing Availability, stage tooling before the machine stops rather than buying faster equipment. If one material causes shortages, adjust that reorder point rather than overhauling inventory policy. Then measure: if the number moved, you understood it.
How often should I review shop floor data? Weekly beats monthly for most operations, and daily is better for fast-moving measures like pace and downtime. Monthly review is essentially an autopsy - by the time you see the problem, the period is over and the loss is unrecoverable. A short cycle keeps the fix and the measurement connected, so you can tell whether a change actually worked while the context is still fresh.
Can AI tell me what to fix on my shop floor? It can tell you where your losses are, quickly, which is the part that usually stalls small manufacturers. A built-in AI agent can answer questions like "what was my biggest loss this week?" across downtime, pace, inventory, and maintenance data without you building a report. What it doesn't do is make the decision - it has no knowledge of your customers, people, or constraints. It removes the extraction work; the judgment stays yours.
The Bottom Line
Getting data off your shop floor is the hard part, and if you've done it, you're ahead of most small manufacturers. But tracking was never the goal. The goal is deciding - and the return on all that measurement only arrives when a number changes what you do.
The loop is simple enough to run this week: find your biggest loss, drill into its specific cause, make the smallest change that addresses it, then measure again. When the number moves, you understood the problem. When it doesn't, you learned cheaply. Either way you go again, and the next biggest loss becomes the target.
What stops most shops isn't bad data - it's the distance between having the data and getting the answer. Close that distance, whether by shortening your review cycle, looking across your modules instead of within them, or simply asking the question directly instead of building the report. Then act on what you find.
You did the hard part already. Now go use it.
Deploy in minutes, not months
Solve your biggest shop floor problem this week.
MikroMES gives you modular, AI-powered apps for downtime, inventory, production pacing, and maintenance — with FabAI, your built-in agent, surfacing the insights you'd otherwise miss. Pick only what you need. Free tier forever, no hardware, no IT project.
✓ Free tier forever · ✓ Deploy in minutes · ✓ No IT department needed
Guy Mizrahi is the co-founder of MikroMES and has 20+ years of experience in MES and manufacturing operations.